Learn about K-Means Clustering
K-means clustering is a method of unsupervised learning used when you have unlabeled data. A typical unsupervised algorithm assumes that the output has been labeled without considering the input vectors.

What is Clustering?
Cluster analysis is one of the most common exploratory data analysis techniques used to understand the data structure better. Clustering is the process of grouping similar data points together. An analysis of the cluster identifies the subgroups in the data so that data points in similar clusters are extremely identical, but those in various clusters are highly different.
What is K-Means Clustering?
K-means clustering is a method of unsupervised learning used when you have unlabeled data. A typical unsupervised algorithm assumes that the output has been labeled without considering the input vectors. The primary purpose of the K-means algorithm is to find the group in data, with the number of groups represented by the variable K. K-means seeks to find the centroid by identifying the k number of centroids and allocating every data point to the nearest cluster while keeping the central points as small as possible. The averaging of the data is what the 'means' refers to.

A machine learning expert, Andreas Bu, says the goal of K-means is very simple: group data points related to one another and find patterns. To accomplish this objective, K-means looks for a set number of similar data points.
Let's take a look at the definition of K-means Clustering according to Wikipedia.
K-means clustering is a method of vector quantization, originally from signal processing, that aims to partition n observations into k clusters in which each observation belongs to the cluster with the nearest mean (cluster centers or cluster centroid), serving as a prototype of the cluster. This results in a partitioning of the data space into Voronoi cells. k-means clustering minimizes within-cluster variances (squared Euclidean distances), but not regular Euclidean distances, which would be the more difficult Weber problem: the mean optimizes squared errors, whereas only the geometric median minimizes Euclidean distances. For instance, better Euclidean solutions can be found using k-medians and k-medoids.
Conventional K-Means Algorithm
There are only a few steps in conventional k-means analysis. The first step is to pick a random number of centroids, where the number of clusters you choose equals k. Cluster centers are represented by centroids.
The algorithm works by maximizing expectations in two steps. Each data point is assigned a centroid by the expectation step. This step takes all the points in each cluster and produces a new centroid by summing the values. An example of the conventional version of the k-means algorithm is as follows:

Relevant Articles:
Harshit Gupta, the Programmer Analyst at Cognizant Technology Solutions, explains K means Clustering in a practical approach. The article emphasizes the essential steps in which the K-means algorithm works. Not only this, the article shows the practical implementation of the K-means clustering algorithm using the dataset of customers of a mall that finally obtained 5 clusters in total.
This article describes how the K-means algorithm works. The article has provided an example problem where the Python programming language has been used to show the K-means machine learning algorithm.
Austin L.E. Krause, wrote a project where his supervised learning algorithm classifies recent articles based on clusters of unsupervised learning algorithms. This article used the K-means clustering algorithm that followed various preprocessing steps taken for cleaning the data. The training stages had been speeded up by clustering each article into 100 words. The project had used the created clusters to add the new column to the data frame that showed each news article’s assigned cluster.
K-means Algorithm
When the centroids have converged, the squared error (SSE) is computed for each cluster or is calculated if the cluster assignment matches the previous iteration. K-means reduce this error value as much as possible by combining the squared Euclidean distances of individual points to their closest centroid.
Two separate runs of k-means are shown on the figure along with the centroids and SSE updates through the first five iterations.`
The purpose of this figure is to underscore the importance of initializing the centroids, and it also demonstrates how to use SSE as a measure of cluster performance. In the expectation-maximization process, the centroid positions are converged until they remain the same after choosing several clusters and centroids. The k-means algorithm is commonly initialized several times, and researchers choose the cluster assignments from those initializations with the lowest SSE.
Evaluation Method
Since K clusters are used in the downstream modeling, the cluster-predict methodology allows us to assess how well the models perform. As a starting point, let's review two metrics that could help us gain some intuition about K:
- Elbow method
- Silhouette analysis
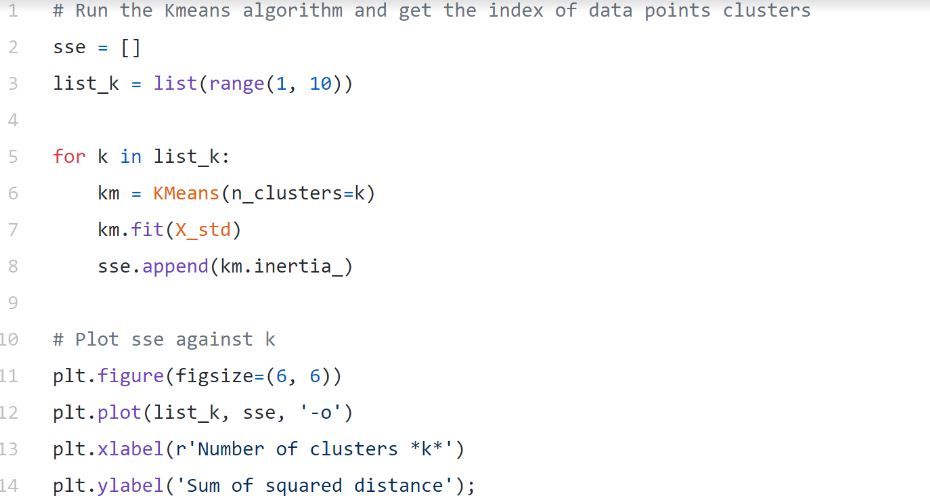
Based on the sum of squared distances (SSE) between each data point and the assigned cluster's central point, the Elbow method gives us an idea of how many clusters to use. K is picked when SSE flattens out to form an elbow. Using the geyser dataset, we'll calculate SSE for different values of k, then examine whether the curve begins to curve out.
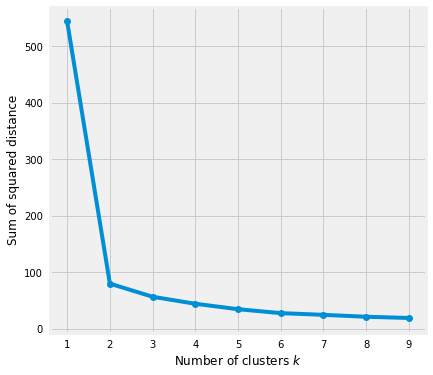
In the graph above, k=2 looks like a good choice. It is still hard to determine the correct number of clusters to use if the trend line is monotonically decreasing without any prominent elbows or a point where it flattens out.
Pros of K means method
- The simplicity of K-means is the major advantage over neural networks, as it is an easy way to explain the results.
- If there are problems, K-means are flexible enough to be adjusted.
- Clustering results are easy to interpret.
Cons of K means method
- The method cannot establish the most optimal cluster set, and the number of clusters must be determined before the analysis.
- K-means will generate clusters randomly from places selected by the algorithm. According to where the algorithm begins, this can be either good or bad. The center of each cluster is then recalculated until it is found that there aren’t too many clusters, given the number of clusters requested.
- The order in which the data is presented impacts the final results.
Conclusion
This article explained K-means clustering and the algorithm along with the evaluation method. We have attached some of the affiliated links in this article so that it could help you.
Thank you for being here and becoming a part of us. Hope to see you again. Stay tuned for more advanced and technological news.