
Data Science Notes for Freshers
This post guides you through the most important ML algorithms according to the syllabuses of various Data Science degrees offered by Indian Institutions - Quick notes for all Data Science freshers.

Introduction
Data Science combines training disciplines in statistics, mathematics, and computer science. Acquiring a degree in Data Science can help a student make informed decisions using data.
With each passing day, data generated by companies and organizations is increasing, and with that, the need for data science experts who can utilize this to make a positive impact is also increasing. Universities in India are constantly developing courses and graduate programmes to cater to this need.
Check out the list of universities offering these programmes :
- IIT Madras - B.Sc Programming and Data Science - Click here
- NMIMS - B.Sc. Data Science- Click here
- IIT Bombay - M.Sc. Applied Statistics and Informatics - Click here
- Symbiosis University - B.Sc. Data Science - Click here
Apart from the full-time degrees from these reputed universities, you can also take a look at some short duration certificate courses :
- IIT Delhi - 6-month programme in Data Science and Machine Learning - Click here
- BITS Pilani - 11-month programme in Artificial Intelligence and Machine Learning - Click here
- IIM, Ahmedabad - 1-month programme on Artificial Intelligence and Machine Learning for Business - Click here
All these courses have certain ML Algorithms in common, such as Linear Regression, Logistic Regression, Naïve Bayes Classifier and more. In this post, I have curated 'Data Science Notes' by compiling a list of all such algorithms and their respective summaries.
Let's begin!
Linear Regression
Overview:
• Regression is a statistical way to establish a relationship between a dependent variable and a set of the independent variable(s).
• This technique is applicable for Supervised Learning Regression problems where we try to predict a continuous variable.
• Linear Regression can be further classified into two types – Simple and Multiple Linear Regression.
 Contributors to Wikimedia projects
How does it work?
• Linear regression “fits a line” that best describes a linear relationship between the two variables (say height and weight) by the method of Ordinary Least Square (OLS).
• Ordinary Least Squares minimize the sum of squared residuals, residuals being the red and blue lines represented in the below graph.
• The final regression equation is in the form :
Y = β0 + β1*X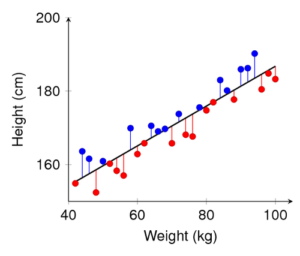
Check out a project on Linear Regression using the Sales and Advertising data:
 pb111
pb111Industry use of Linear Regression :

K-Nearest Neighbour
Overview:
• It is a classification algorithm that takes a bunch of labelled points and uses them to learn how to label other points. It classifies cases based on their similarity to other cases.
• Cases that are near each other are known as neighbours.
Contributors to Wikimedia projects
How does it work?
• Pick a value for 'k'.
• Calculate the distance (Euclidean distance) of the unknown case from all the cases.
• Select the k observations in the training data that are "nearest" to the unknown data point.
• Predict the response of the unknown data point using the most popular response value from k-nearest neighbours.

Example of k-NN classification: The test sample (green dot) should be classified either into blue squares or red triangles. If k = 3 (solid line circle) it is assigned to the red triangles because there are 2 triangles and only 1 square inside the inner circle. If k = 5 (dashed line circle) it is assigned to the blue squares (3 squares vs. 2 triangles inside the outer circle).
How to pick 'k'?
• A small value of k causes a highly complex model that results in overfitting of the data. Whereas, if we choose a high value of k, the model becomes overly generalized.
• Data scientists usually choose an odd number if the number of classes is 2 and another simple approach to select k is to set k=sqrt(n).
Industry use of KNN :
Logistic Regression
Overview:
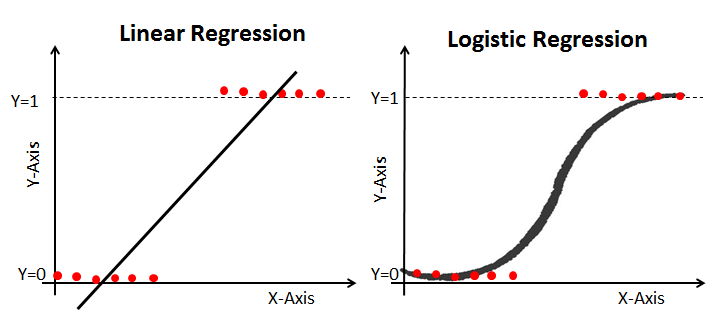
• Logistic regression is a classification method.
• Its main goal is learning a function that returns a yes or no answer when presented as input a so-called feature vector.
• From this, we can infer answers to classification problems, such as 'will an employee stay with an organisation or not ?'
Contributors to Wikimedia projects
How does it work?
• The data structure of logistic regression is pretty much similar to that of linear regression - you have a set of independent variables (height in the previous example) and a dependent variable (weight ).
• Function behind it :

• Logistic regression will estimate the bo parameter, which in turn can be used to calculate the probability using a new set of independent variables. If the probability turns out to be less than 0.5 then it's classified as a 'no'.
Industry use of Logistic Regression:c
Credit Scoring using Logistic Regression by Deloitte - Click here
Naïve Bayes Classifier
Overview:
• Naïve Bayes Classifier is a probabilistic machine learning model that is used for classification problems.
•They are known by a variety of names such as simple Bayes and independence Bayes
• For example, a fruit may be considered to be an apple if it is red, round, and about 10 cm in diameter. A naive Bayes classifier considers each of these features to contribute independently to the probability that this fruit is an apple, regardless of any possible correlations between the colour, roundness, and diameter features.
Contributors to Wikimedia projectsHow does it work?
• The core principle of the classifier is based on Bayes Theorem

• By using this principle, Naïve Bayes Classifier calculates the probability and separates it into a bivariate target variable using a threshold value of 0.5.
Industry use of Naïve Bayes Classifier:
Biological Leukemia Classification - TIBCO
Decision Tree
Overview:
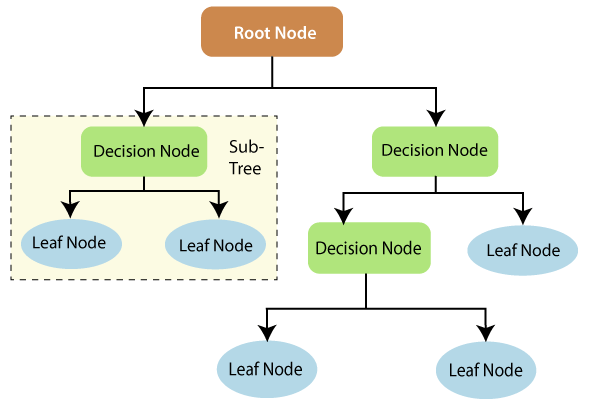
• Decision Tree uses a tree-like structure and their possible combinations to solve a particular problem.
• It belongs to the class of supervised learning algorithms where it can be used for both classification and regression purposes.

How does it work?
• For each attribute in the dataset, the Decision-Tree algorithm forms a node. The most important attribute is placed at the root node.
• For evaluating the task in hand, we start at the root node and we work our way down the tree by following the corresponding node that meets our condition or decision.
• This process continues until a leaf node is reached. It contains the prediction or the outcome of the Decision Tree.

Industry use of Decision Tree:


Random Forest
Overview:
• A random forest is a supervised machine learning technique that uses decision tree algorithms to build it. This algorithm is used to anticipate behaviour.
• Its ease of use and flexibility have fueled its adoption, as it handles both classification and regression problems.
Contributors to Wikimedia projects
How does it work?
• Random forest builds several decision trees and combines them to make predictions more reliable and stable.
• The random forest has the same hyperparameters as the decision tree or the baggage classifier.
• The Random Forest adds additional randomness to the model as the trees expand.
Industry use of Random Forest
Predicting System Disruption in Industry using Random Forest
Support Vector Machines
Overview:
• Support vector machines (SVMs) are a particularly powerful and flexible class of supervised algorithms for both classification and regression.
• Naïve Bayes is an example of a generative classifier whereas Support Vector Machine is an example of a discriminative classifier.
• SVM divides the classes by simply drawing a line or a curve.
Contributors to Wikimedia projects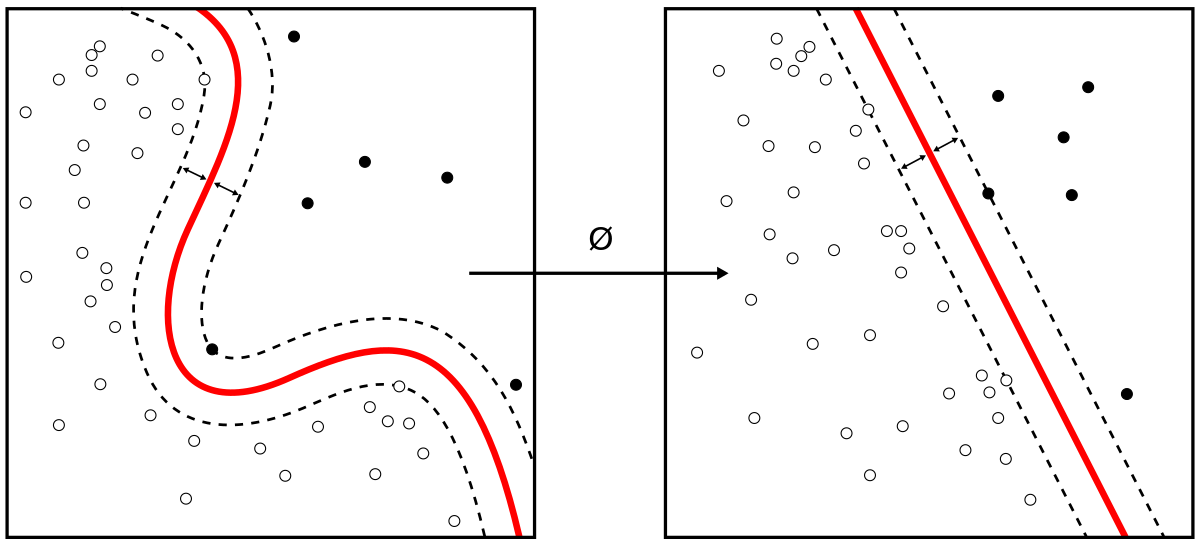
How does it work?
• Consider the below data, the separation of classes is rather easy and can be done manually.
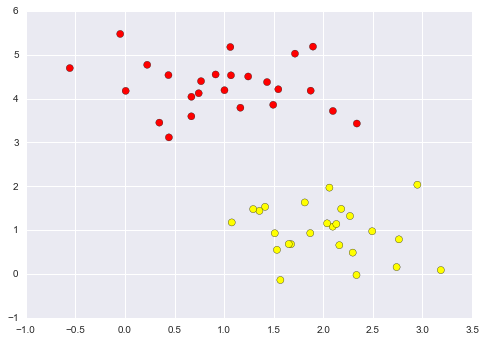
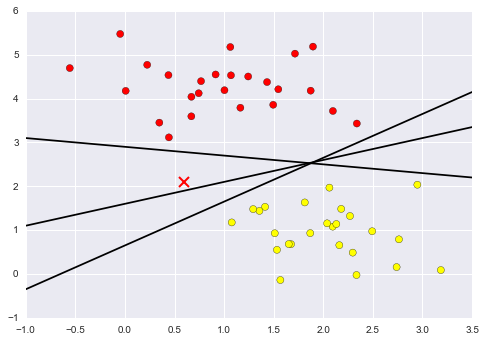
• There are 3 different separators, which perfectly discriminate between the two classes.
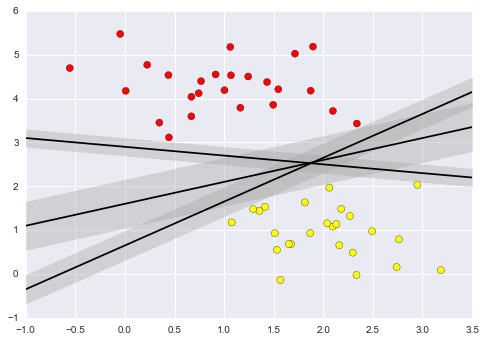
• Rather than simply drawing a zero-width line between the classes, we can draw around each line a margin of some width, up to the nearest point. In support vector machines, the line that maximizes this margin is the one we will choose as the optimal model.
Industry use of Support Vector Machines:

Conclusion
I hope this post guides you through all the basic ML Algorithms and their inner functionalities.
For more such content, - consider subscribing.
See you next time!


