
Android Apps Data Analysis with Google sheets
As a Business graduate in a world where Artificial Intelligence and Data Science are taking over industries and optimizing various business processes, it is critical for you to embrace AI.

As a Business graduate in a world where Artificial Intelligence and Data Science are taking over industries and optimizing various business processes, it is critical for you to embrace AI.
In this article, we will showcase how you can start developing AI skills and become part of the same ecosystem that DS and AI professionals benefit from every day.
Google Sheets
Google Sheets is one of the most powerful web-based tools for Data Analysis.
Check out the Android Apps dataset we have created for your analysis.
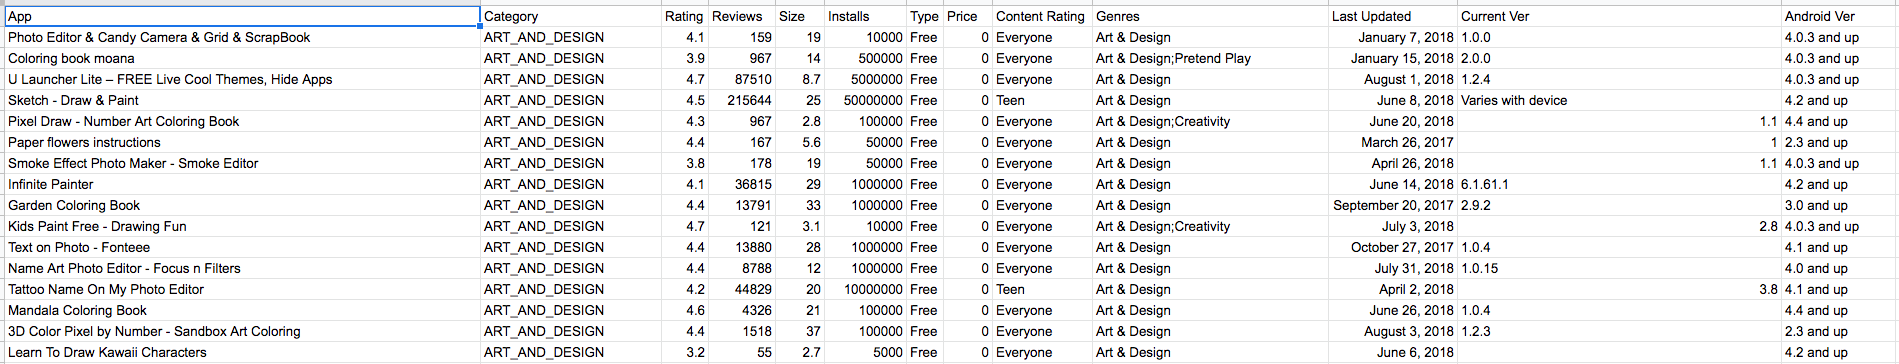
The dataset provides a rich collection of attributes for nearly ten thousand Play Store apps.
Aggregations
In any data analysis workflow, the first aspect is to get a general sense of how many items you are dealing with.
You can start with the overall number of Apps.
You can then ask questions like how many apps by category? To answer this you can select to Insert a Pivot Table and play with which data attribute you want to use as a row or column.
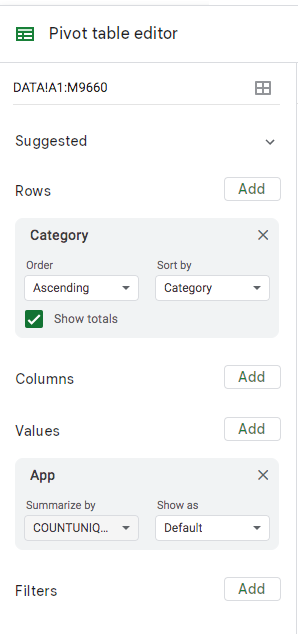
When you insert a pivot table, you are presented with the Pivot table editor (above).
I have chosen Category as rows and App as Values. Notice the "Summarize by" field. This needs to be chosen appropriately. In my case, I have chosen to count unique Apps by Category.
As soon as I do this, I see the following;
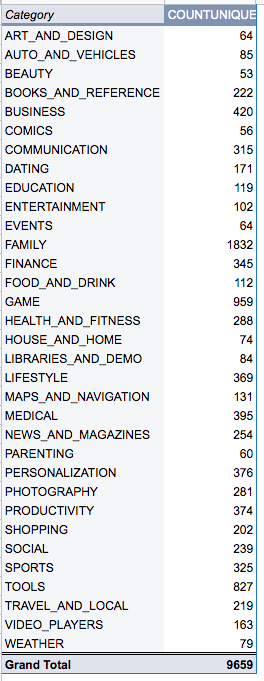
Now we have a pretty good idea about the distribution of our Apps across various Categories.
Seems like Family takes the top spot with the most number of apps in this category.
How about we visualize this? Very easy. You can select the two columns and insert a Chart.
Google Sheets is smart enough to pick an appropriate Chart type for you. As you can see below, the Chart type is a pie chart and we can see % distribution of App categories.
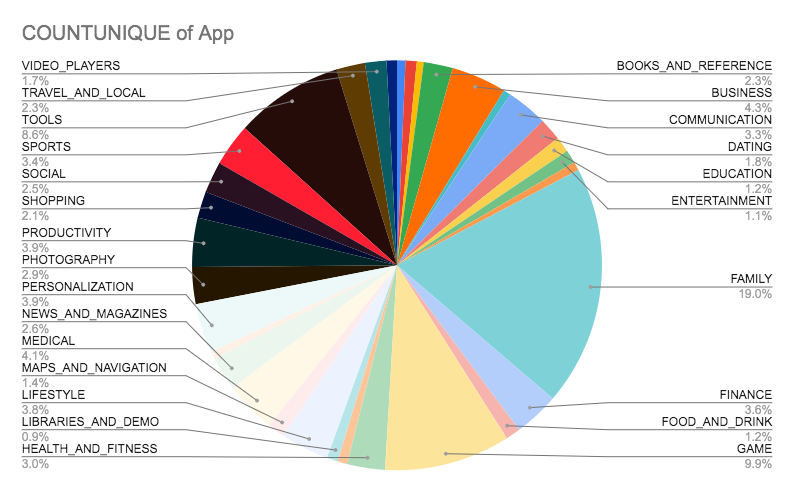
Family apps and Game apps are the top two categories of apps on the Play store. No surprises there.
Go check out this Google Sheet, make a copy and analyze the data to learn one of the most essential Tools for Data Analysis.


