
Confidence Intervals: A Deep Dive for the Technical Professional
At its core, a Confidence Interval is a range of values we are fairly sure our true value lies in.
Hello, savvy readers!
Today, we're about to embark on an exhilarating journey through the fascinating world of statistics and more specifically, Confidence Intervals (CIs). Now, I know many of you might think, "Ah, just another boring statistics topic." But trust me, understanding CIs is like owning a crystal ball into the heart of your data, offering insights with a dash of uncertainty!
The Basics
At its core, a Confidence Interval is a range of values we are fairly sure our true value lies in. Imagine you're attempting to gauge the average height of all men in a particular city. You randomly sample 100 men, compute the average height, and end up with, say, 5'9". But does this mean the true average height of all men in the city is 5'9"? Not necessarily!
Enter Confidence Intervals!
Instead of saying the average is exactly 5'9", a confidence interval might give you a range, say between 5'7" and 5'11". This means you're pretty confident (usually 95% confident, but we'll delve into that in a bit) that the true average height for all men in that city lies somewhere between those two numbers.
Why can't we be 100% sure?
Life is uncertain, and so is data. When sampling, there's always variability. No two samples will give you exactly the same average. So, while your sample might yield an average of 5'9", another might give 5'8" or 5'10". This variability is where CIs come in, providing a range that accounts for this uncertainty.
The Mechanics
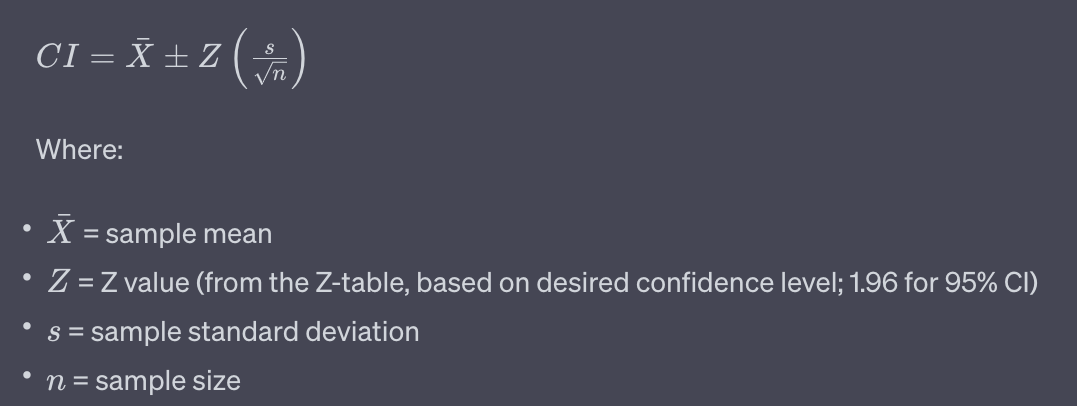
For those wanting to peek under the hood, the formula to calculate a CI for a mean (assuming a normal distribution) is:
Choosing Your Confidence Level
While 95% is the most commonly used confidence level, it's not set in stone. Want to be more sure? Go for a 99% CI. But remember, a higher confidence level means a wider interval.
Visualizing with a Margin of Error
The term (screenshot below) is essentially the margin of error. Think of it as the buffer you add or subtract from your sample mean.

Wrap-up
The beauty of Confidence Intervals is their ability to succinctly communicate both our best estimate from the data (point estimate) and the uncertainty associated with that estimate (interval). Whether you're testing a new product, gauging user reactions, or simply measuring real-world phenomena, CIs should be in your statistical toolkit!
So, the next time you're presented with a statistic or average, ask yourself: "What's the interval?" Because in the world of data, it's not just about the destination, it's also about the journey and the space we traverse in between!
Remember, statistics isn't just about crunching numbers; it's about making informed decisions in the face of uncertainty. Dive deep, stay curious, and always be confident in your intervals!
Until next time,
The Confidence Interval Influencer